
The Cause(s) of Our Inflation
2019-2024 | A Non-Partisan Analysis

Intro:
(Disclaimer: This post is retrospective. I did not publish during the time I wrote it because many business matters took all my time. I am still publishing this as an addendum to my last post to give an example of how to use economic analysis as I said I would).
In my previous blog post, Professional Benefits of an Economics Degree, I explored how the analytical tools and critical thinking skills acquired through studying economics can benefit one’s professional career. Today, I want to dive deeper into the practical application of those skills by examining one of the most pressing economic issues of our time—global inflation. Understanding the causes of inflation is not only crucial for economists but for anyone navigating today’s economy. Through this analysis, I aim to showcase how economic thinking can shed light on complex real-world issues, help us better understand the forces shaping our financial future, and provide the example of utilizing economics skills that I promised in my last blog post.
In this case, I’ll walk you through my approach to analyzing current inflation trends and forecasting when interest rates might be lowered (I am late on this post but my analysis was conducted in May 2024 where I predicted a September 2024 interest rate cut and was correct). This will illustrate how the critical thinking, data analysis, and economic reasoning fostered by an economics education can be used to make informed predictions about major economic shifts.
Over the past year inflation has been a hot topic in financial markets, economic circles, and amongst the entire world population. There have been many ways that people are pointing the finger to the “cause” of this inflation. Some say COVID, some say the COVID response (stimulus and/or the economic shutdown), some say it was a supply chain break down, some say it’s increased government spending (Infrastructure Investment and Jobs Act), subsidies for green projects (Inflation Reduction Act), and re-shoring critical industries (CHIPS and Science Act), and some say it is simply greedy corporations price gouging.
All of these are overly simplistic, it is everything, all of the above. The explanations I have seen primarily consists of misconceptions, partial information, and partial opinions. I am hoping to give the reader a holistic understanding of the dynamic forces influencing inflation in today’s world.
With that spirit in mind, let’s get into it.
Disclaimer:
This will be a basic analysis, as a full analysis would be a full-time job. This is merely so the reader can understand how an economics degree can result in increased clarity when observing our world, and hopefully gain an increased understanding of inflation and our current economic environment.
Table of Contents:
Definition of Inflation
Let’s first define inflation:
Inflation refers to the sustained increase in the general level of prices for goods and services in an economy over a period of time. As prices rise, the purchasing power of currency falls, meaning each unit of currency buys fewer goods and services.
It can also be defined as the result of the set of all money chasing the set of all goods. Meaning, if the money supply increases, inflation will result, if the production of goods fall, inflation will result.
It is when the price of things increases.
The Types of Inflation & Their Causes
Now let’s look at the common types of inflation and their causes:
Monetary Inflation:
Monetary inflation occurs when the money supply grows faster than the economy's ability to produce goods and services. This excess money circulating in the economy leads to increased demand, which, without a corresponding increase in supply, results in higher prices. Monetary inflation is often associated with demand-pull inflation, where increased money supply leads to higher consumer demand, pushing prices up. In extreme cases, it can also lead to hyperinflation if the money supply grows uncontrollably.
It is when we have too much money in the economy.
Demand-Pull Inflation:
This occurs when the demand for goods and services exceeds the economy’s productive capacity, leading to price increases. It’s typically caused by:
Increased consumer spending due to higher wages, tax cuts, or lower interest rates.
Government fiscal stimulus (e.g., public spending on infrastructure).
Increased exports leading to more foreign demand.
It is when more people are buying more things.
Cost-Push Inflation:
This arises when the costs of production (wages, raw materials, etc.) increase, and businesses pass on those costs to consumers in the form of higher prices. It can be triggered by:
Rising oil prices or other essential raw materials.
Wage hikes due to strong labor unions or minimum wage laws.
Supply chain disruptions or shortages.
This is when business costs go up, so price goes up as businesses preserve their profit margin.
Pricing Power Inflation:
This type of inflation occurs when businesses raise prices simply because they can, without a corresponding increase in costs or demand. Common types of Pricing Power Inflation include:
Monopolistic or oligopolistic market conditions: Firms with significant market power may raise prices without fear of losing customers to competitors (OPEC).
Consumer inelasticity: When consumers have no alternatives or when the good is a necessity (like healthcare, utilities, or gas), businesses might exploit this and increase prices.
Shrinkflation: A form of hidden inflation where companies reduce the size or quantity of a product while maintaining the same price, effectively increasing the cost per unit without overtly raising prices.
Price Gouging: The practice of raising prices excessively during times of high demand or crisis, such as natural disasters or emergencies, often taking advantage of consumers' urgent needs.
How We Measure Inflation
Inflation is primarily measured through the use of indexes.
An index, in the context of economics, is a statistical measure that tracks changes in the value of a basket of goods and services over time, providing a way to quantify price changes (inflation) or other economic variables. Indices are essential tools in understanding inflation because they aggregate a broad range of data into a single figure that represents general trends in the economy.
It’s a collection of the price of different items that we average to get a quantified summary of prices.
Common Inflation Measurement Indices:
Consumer Price Index (CPI):
Definition: The CPI measures the average change in prices paid by consumers for a representative basket of goods and services, such as food, housing, transportation, and healthcare.
How It's Used: It’s one of the most widely used measures to track inflation because it reflects the cost of living for consumers.
Weaknesses:
Substitution Bias: The CPI assumes a fixed basket of goods, but consumers may substitute cheaper alternatives as prices rise, which CPI doesn’t account for.
Quality Adjustments: If products improve in quality, their prices may rise, but the CPI may count this price increase as inflation, even though the product is better.
Doesn't Fully Reflect Everyone's Costs: Different income groups may face different inflation rates based on their spending habits, but the CPI aggregates across all groups, which can be misleading.
Producer Price Index (PPI):
Definition: The PPI measures the average change over time in the selling prices received by domestic producers for their output. It reflects inflation at the wholesale level.
It is what businesses pay for their inputs.
How It's Used: Economists use PPI to anticipate future consumer price inflation, as rising producer costs are often passed on to consumers.
Weaknesses:
Limited Scope: PPI only covers the prices producers receive, so it doesn’t account for retail or consumer-level inflation.
Volatility: PPI can be highly volatile due to its sensitivity to changes in raw material prices, which may not always translate directly into consumer inflation.
Personal Consumption Expenditures Price Index (PCE):
Definition: The PCE measures changes in the price of goods and services consumed by households. It’s similar to the CPI but includes a broader range of expenditures.
How It's Used: The Federal Reserve uses the PCE as its preferred inflation measure because it accounts for a wider range of expenditures, including things like healthcare paid for by third parties.
Weaknesses:
Complexity: The PCE is more difficult to understand than the CPI due to its use of different methodologies and broader categories.
Lag: The data for PCE comes from national accounts, which can sometimes cause it to lag behind real-time market changes.
Learn more here.
Core Inflation:
Definition: Core inflation is a variant of both the CPI and PCE that excludes food and energy prices due to their volatility. Both food and energy rely on volatile commodities markets that may be disrupted without a broader trend of inflation occurring.
How It’s Used: Economists use core inflation to get a clearer sense of long-term inflation trends, as short-term fluctuations in food and energy can distort broader inflation trends.
Weaknesses:
Excluding Vital Sectors: While food and energy prices can be volatile, they are also critical components of living expenses. Excluding them may provide an incomplete picture of inflation's real impact on consumers.
Criticisms and Controversies Surrounding Inflation Indices:
Inflation Misrepresentation:
Critics argue that indices like the CPI may understate or overstate inflation depending on how the basket of goods is constructed and updated. For instance, slow adjustments to reflect technological changes or changes in consumer behavior may skew results.
Housing Costs:
Housing costs, which are a major part of household expenses, are often handled differently across indices. In CPI, "Owners' Equivalent Rent" (OER) is used to estimate the cost of housing, but this doesn’t capture the true cost of homeownership for all, especially during volatile housing markets.
Bias Toward Urban Consumers:
CPI, for example, primarily tracks urban consumers, meaning that rural inflation experiences can be vastly different. This urban bias leads to some communities feeling misrepresented by official inflation measures.
Perception vs. Reality:
There’s a common public perception that inflation feels higher than what official statistics report. This is often due to personal inflation experiences varying significantly, especially when essential goods (like groceries) experience rapid price increases, which may not fully be reflected in the indices.
Political Influence:
There is also skepticism that changes in how inflation is measured over the years—such as adjustments to how housing costs or healthcare are treated—may have been influenced by political motives to show lower inflation, particularly because inflation figures are tied to things like cost-of-living adjustments for social security, wage negotiations, monetary policy, and re-election
While the adjustments made to inflation indices are typically the result of economic methodology rather than direct political intervention, the perception that inflation numbers are "gerrymandered" has persisted, particularly during times of economic stress or rising prices. However, no substantial evidence supports the claim that inflation data is deliberately manipulated by politicians to aid in re-election efforts..
By recognizing both the value and limitations of these indices, it becomes clear that measuring inflation is not a straightforward task. While they provide a good approximation, it’s important to interpret them carefully, understanding the nuances and potential biases built into their methodologies.
The Causes of Our Inflation
With the fundamentals out of the way let’s dive into it. What is causing the inflation today?
Typically, when I do an analysis on complex things, I break out the myriad possible causes, and the typical and wisest answer is “all of them”, it is just a matter of degree. So in the following sections I will outline how we are experiencing Monetary Inflation, Demand-Pull Inflation, Cost-Push Inflation, Pricing Power Inflation, and some special cases of inflation.
Let’s first start with a historical backdrop from 2000-2024.
Historical Backdrop:
The chart below depicts the inflation rate of consumer prices in the United States, as measured annually, from 2000 to 2023. The data source is the World Bank, and the chart is provided by the Federal Reserve Economic Data (FRED) system. The shaded areas reflect periods of U.S. recessions.
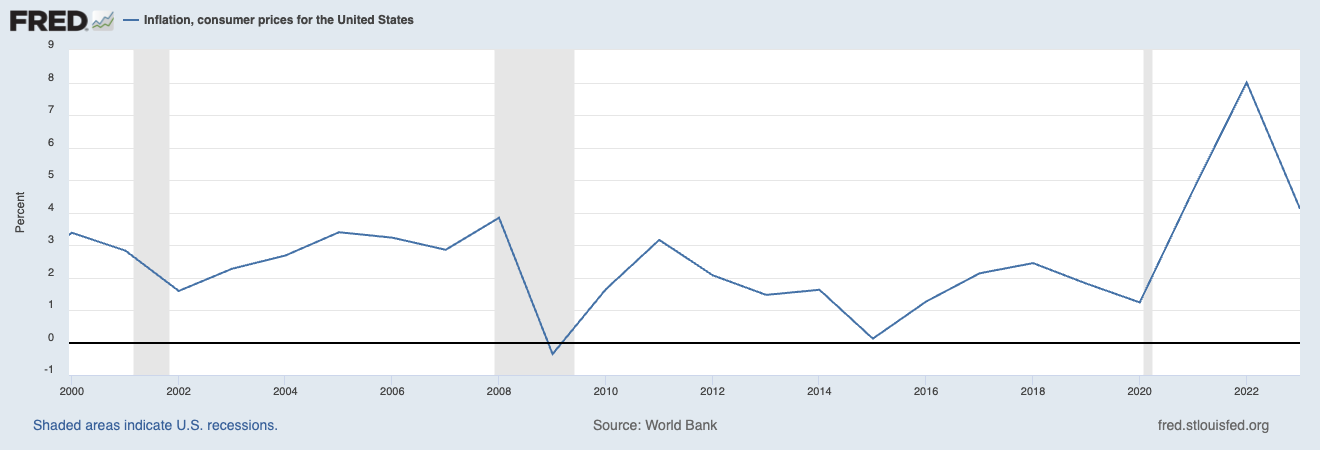
Just observe the chart for a minute to get an idea of what has happened over the past 24 years.
Let’s analyze what has happened:
Early 2000s: The inflation rate hovers between 1.5% to 4%. There is a gradual decline around 2002, followed by stabilization. Following the “dot-com crisis” denoted by the gray shading.
2008 Financial Crisis: Inflation saw a sharp decline, dropping below 1% during the global financial crisis (GFC) and subsequent recession, as indicated by the shaded area around 2008-2009. The economic downturn resulted in a significant decrease in aggregate demand, leading to deflationary pressures. The preceding rise in inflation can likely be attributed to monetary factors, specifically the expansion of the money supply fueled by excessive subprime lending and loose credit conditions, which contributed to overheating in the housing market and broader economy before the crisis unfolded.
Post-Crisis Recovery: Inflation spikes after the crisis, peaking around 2011 at ~3.1%, and then declines gradually through the mid-2010s reaching a low of .25% in 2015, possibly signaling weak expansion of the nations productive capacity.
Pandemic and Beyond: There’s a sharp rise starting around 2021, peaking in 2022, reflecting the inflationary pressures caused by the COVID-19 pandemic, supply chain disruptions, and other macroeconomic factors (of which is the subject of this blog post).
Key Observations:
Deflation/Low Inflation (2008-2009): The drop during the financial crisis reflects reduced demand and lower prices.
High Inflation (2021-2022): The steep rise toward the end of the chart likely corresponds to the economic recovery post-pandemic, combined with supply chain issues and rising energy costs.
Now, let’s look at a bar graph on inflation from 2014-2024 to get a different visual perspective:
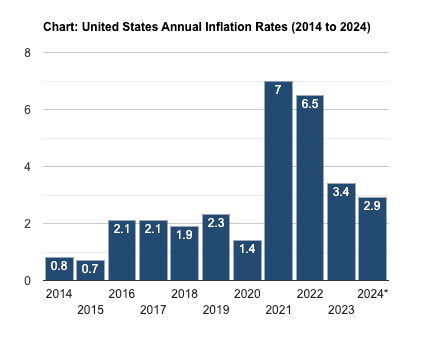
The charts above provide a historical perspective of inflation trends in the U.S. economy, reflecting major economic events like the financial crisis and the pandemic.
Remnants of Inflation Past:
The historical backdrop of inflation remains crucial in setting the stage for our analysis. Certain sectors, particularly housing, continue to experience inflationary pressures that can be traced back to the aftermath of the GFC. The GFC led to a sharp decline in the construction industry, stalling new housing development and causing a significant housing shortage. This undersupply has persisted for over a decade, exacerbated by immigration, as the slow recovery in construction, coupled with growing demand, has continued to drive up housing prices, leaving a lingering inflationary effect in the sector to this day. Therefore, as we analyze inflation over the past several years, it's important to recognize that housing inflation had already gained significant momentum prior to the pandemic, exacerbating its negative effects in the current economic landscape. This is an example of why looking at the historical backdrop is a crucial first step in any analysis.
Now that we have established the historical setting of inflation, it’s time for our analysis to begin.
Inflationary Pressures:
Inflation is not a one-dimensional issue; it is a complex adaptive system shaped by numerous factors pulling and pushing in different directions. Imagine an intricate ecosystem, where changes in one area can set off a cascade of domino and rippling effects throughout the entire environment. It works something like a hydraulic system (60 second short on hydraulic pressures and responses). Though COVID-19—and our response to it—can reliably be cited as the catalyst for the 2020-2024 inflation and the lingering inflation we are experiencing today, this is only part of the story. Beneath the surface lies a confluence of forces working in tandem, often with opposing pressures, contributing to the rise in prices across the globe.
In the following sections, I will attempt to lift the veil on this intricate system, exploring the various inflationary pressures driving the economic turbulence we face today. From excess money supply and rising consumer demand to supply-side constraints and corporate pricing power, the forces at play are diverse and dynamic. We will walk through the mechanics of these pressures—including Monetary Inflation, Demand-Pull Inflation, Cost-Push Inflation, Pricing Power Inflation, and other Special Cases—each adding a unique thread to the fabric of our global inflation crisis.
Monetary Inflation:
"Inflation is always and everywhere a monetary phenomenon in the sense that it is and can be produced only by a more rapid increase in the quantity of money than in output."- Milton Friedman
I don’t know if the above quotation is true. I haven’t studied inflation long enough to be able to issue an opinion, but my feeling is other constraints clearly cause inflation too. However, for the purpose of this section’s analysis, let’s go with it.
An excess of money circulating in the economy can cause inflation. Indeed, history corroborates this claim. When Mansa Musa, the emperor of Mali and debatably the richest man ever to exist, embarked on his famous Islamic pilgrimage to Mecca in 1324, he traveled with a vast entourage and an immense quantity of gold. As he passed through cities across North Africa, including Cairo, Musa generously distributed gold to the local populations, making lavish gifts to rulers, merchants, and the poor along with his lavish spending for himself and his entourage.
While his wealth and generosity were legendary, the sudden influx of gold into these regions caused a rapid increase in the money supply, leading to monetary inflation. In places like Cairo, the excess gold devalued its worth, driving up prices for goods and destabilizing the local economies for over a decade. Musa’s displays of wealth and acts of charity inadvertently disrupted trade and daily life, illustrating how the unbalanced introduction of wealth can lead to economic turmoil. (Mecca Pilgrimage of Mansa Musa: When generosity caused inflation).
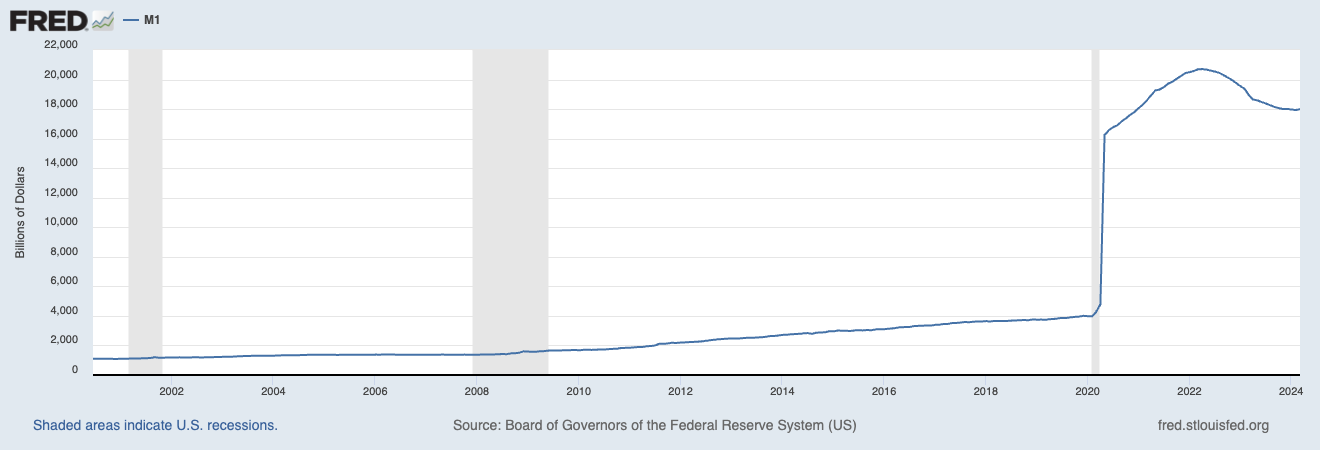
In response to the COVID-19 pandemic, the U.S. government and Federal Reserve took unprecedented fiscal and monetary actions, such as stimulus checks, expanded unemployment benefits, and asset purchases (quantitative easing). This led to a significant expansion of the money supply, particularly in the form of bank reserves and broad money measures like M2.
M1 (2020-2021 Increase)
M1 includes physical currency, demand deposits, and other liquid forms of money.
M1 increased by over 350% during this period, largely due to the reclassification of certain savings accounts into M1 by the Federal Reserve in 2020. In April 2020, the Fed removed the regulation that limited the number of withdrawals from savings accounts, making them more liquid and, therefore, part of M1. This regulatory change significantly inflated M1 figures.
M2 (2020-2021 Increase)
M2 includes M1 plus savings accounts, small time deposits, and retail money market mutual funds.
M2 increased by approximately 40% between early 2020 and the end of 2021. This growth was due to the unprecedented stimulus measures taken by the U.S. government and Federal Reserve, which injected liquidity into the economy through fiscal stimulus payments, expanded unemployment benefits, and asset purchases.
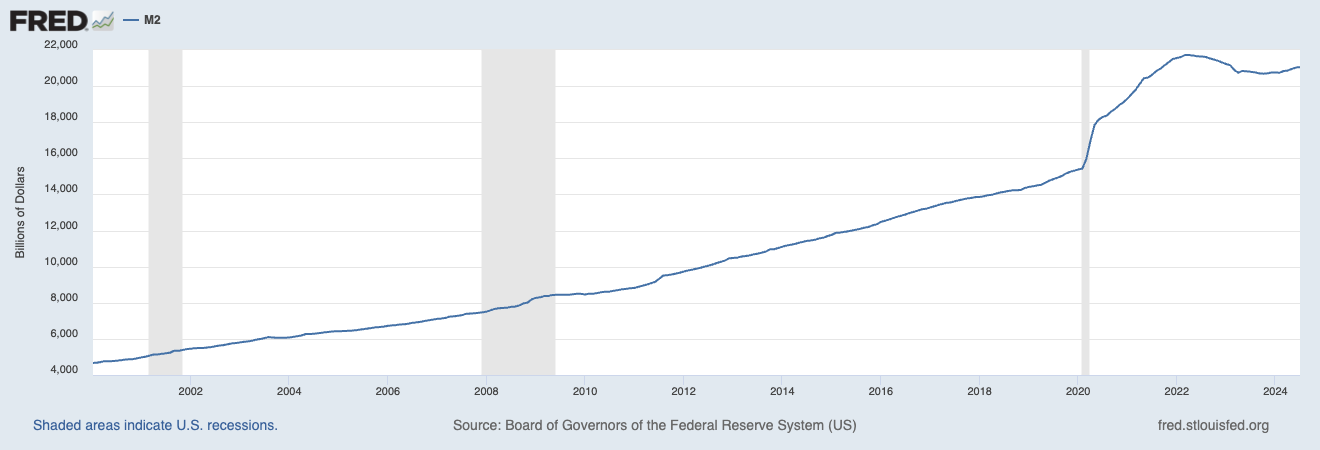
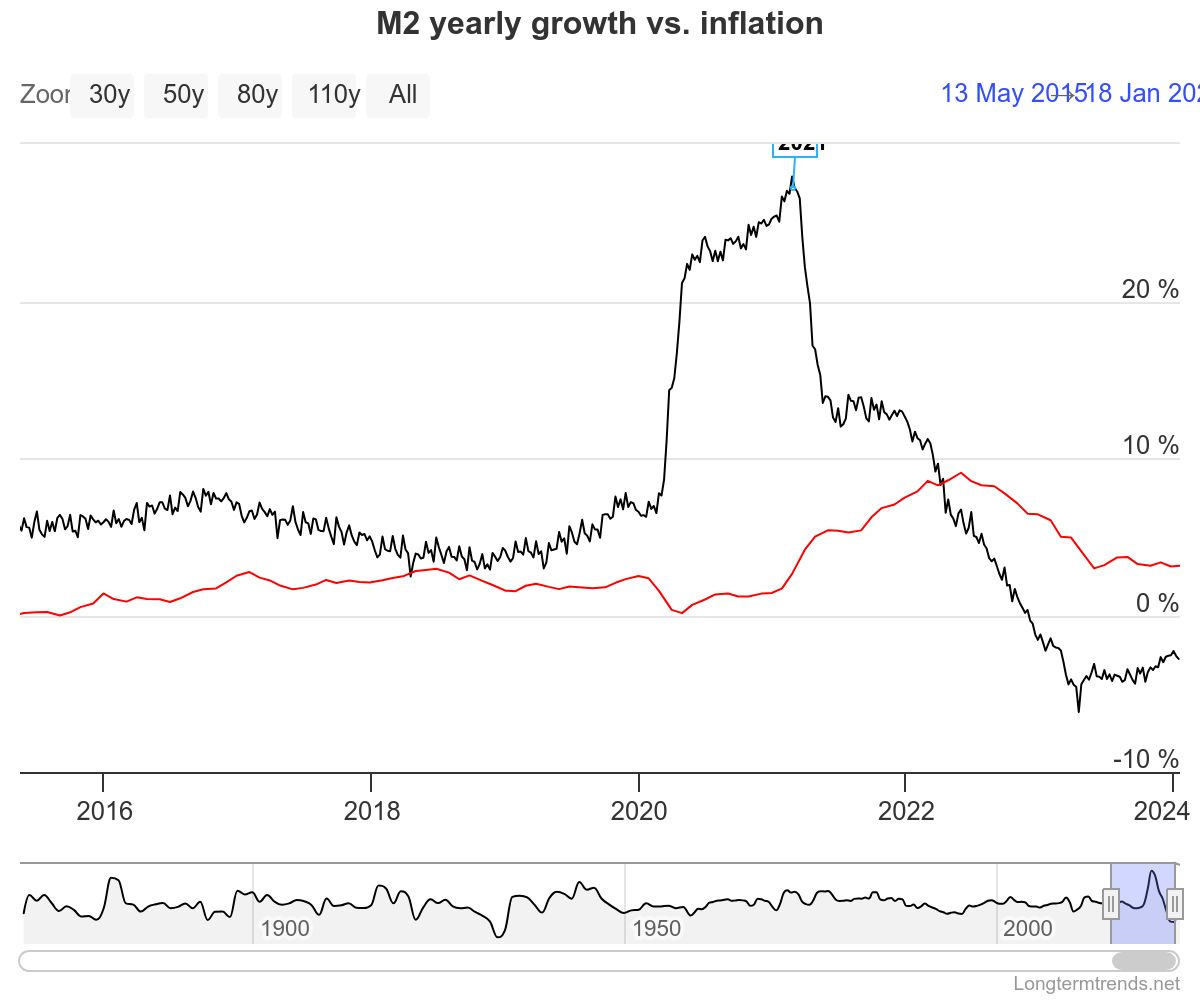
These dramatic increases in the money supply contributed to inflationary pressures, although the reclassification of savings accounts affected M1 data more directly.
This rapid increase in liquidity contributed to inflationary pressures by driving demand while supply chains were constrained. Think about it simply, you have more money (people immediately feel more wealthy, without realizing they aren’t) increase spending, and that increases the competition for goods which leads to inflation.
Based on the above graphs and data, you can reasonably conclude that an increase in the money supply of that magnitude (that occurred during BOTH the Trump and Biden Administration [don’t be biased when evaluating data]), would have a proportional increase of the magnitude of inflation. This particular analysis is not rocket science.
Simply put, you cannot put that much money into any system and not experience inflation.
International Effects:
The rapid expansion of the U.S. money supply led to global inflationary pressures by weakening the U.S. dollar, raising the cost of imports for many countries; spurred capital flows to emerging markets, which later faced rising debt burdens when the Federal Reserve signaled tightening; fueled a surge in commodity prices as investors sought higher returns, impacting countries reliant on importing essentials like oil and food; exacerbated global supply chain disruptions due to increased demand for goods from U.S. consumers; and caused currency depreciation in many economies, further driving inflation and complicating debt management for countries with large dollar-denominated liabilities. (Going further on this topic is beyond the scope of this post).
How Monetary Inflation Can Hide a Weakened Economy
Monetary inflation, while often viewed as a signal of economic activity, can mask deeper structural weaknesses in an economy. One of the ways this happens is by artificially propping up the performance of financial markets. When the money supply increases rapidly, it boosts liquidity, pushing asset prices higher and creating the illusion of a thriving economy. Stock markets, real estate, and other asset classes see rising valuations, leading to the appearance of economic strength, even when underlying indicators suggest otherwise. While certain economic measures like GDP growth may appear healthy, much of this growth can be attributed to monetary inflation rather than genuine increases in productivity or economic output.
This type of inflation also obscures poor asset returns. As asset prices rise due to the increased money supply, investors may feel wealthier, but real returns—adjusted for inflation—often stagnate or decline. The inflation of asset prices provides a superficial sense of wealth, making it harder to detect when the actual value of investments is being eroded by inflation.
Furthermore, monetary inflation is one of the easiest ways for governments to impose an invisible tax on the population. As inflation diminishes purchasing power, consumers face higher prices, but many are unaware that this is effectively a tax on their income and savings. Meanwhile, it allows the government to cover deficits and debt without explicitly raising taxes, which can mask fiscal challenges in the broader economy.
In essence, while monetary inflation can drive up asset prices and create the illusion of prosperity, it often hides underlying economic fragility, unsustainable growth, and weak real returns. Instead of reflecting a genuinely strong economy, much of what we observe in markets and GDP growth may simply be the result of inflationary forces at work.
Here are some graphs that illustrate these affects:
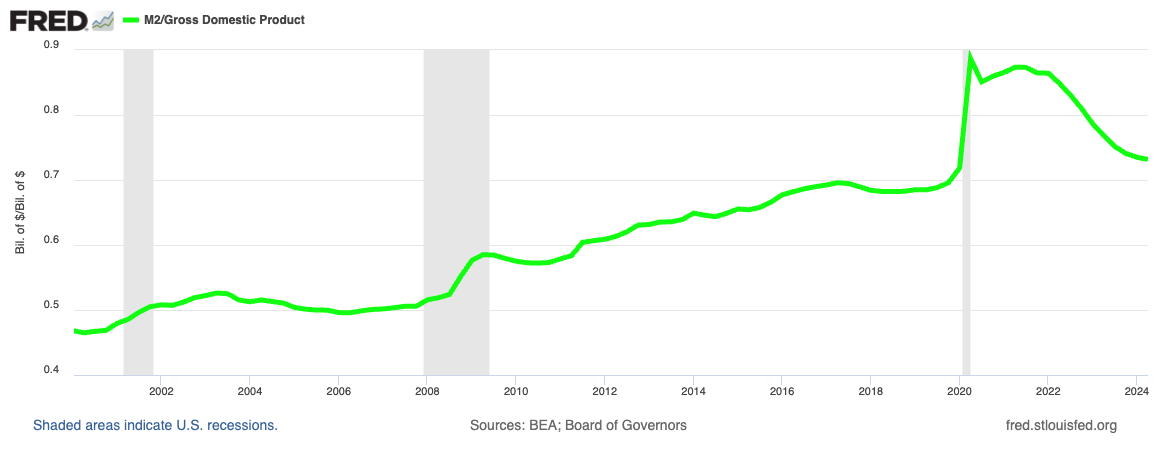
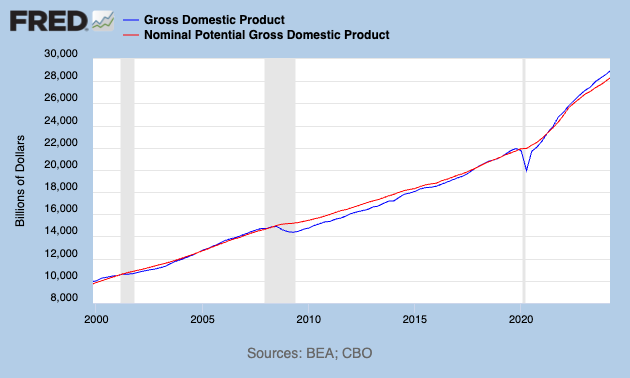
The ratio compares how much money (M2) is in the economy relative to the size of the economy (GDP). If the ratio is increasing, it means that the money supply is growing faster than the economy’s output. If it’s decreasing, it means that GDP is growing faster than the money supply.
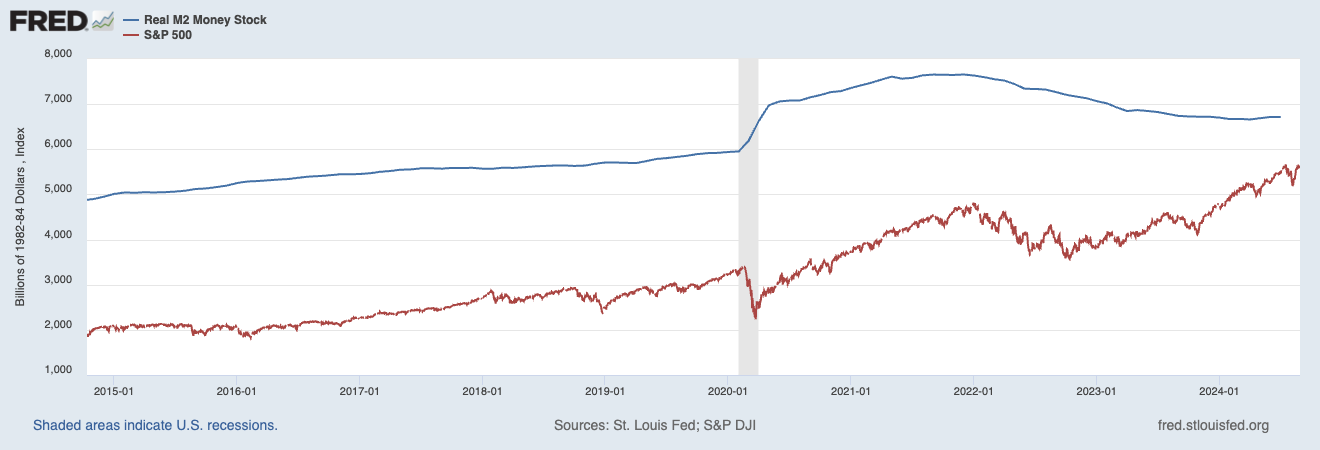
This graph compares the Real M2 Money Stock (adjusted for inflation) with the S&P 500 Index from around 2015 to 2024. The blue line represents the money supply (M2), and the red line shows the S&P 500, a major U.S. stock market index. From 2015 to early 2020, the M2 and S&P 500 followed relatively stable upward trends. However, in early 2020, during the COVID-19 pandemic, M2 experienced a significant spike due to massive monetary stimulus and fiscal measures, while the S&P 500 saw a sharp dip but quickly rebounded, correlating with the increase in liquidity. Post-pandemic, the M2 supply leveled off and slightly declined from 2021 onwards as the Federal Reserve tightened monetary policy, but the S&P 500 continued its upward trend, reflecting continued asset price inflation despite a contraction in the money supply. This divergence highlights how monetary policy and liquidity injections can initially boost asset prices, but even as liquidity tightens, asset markets can continue to rise based on market momentum, investor sentiment, or other factors.
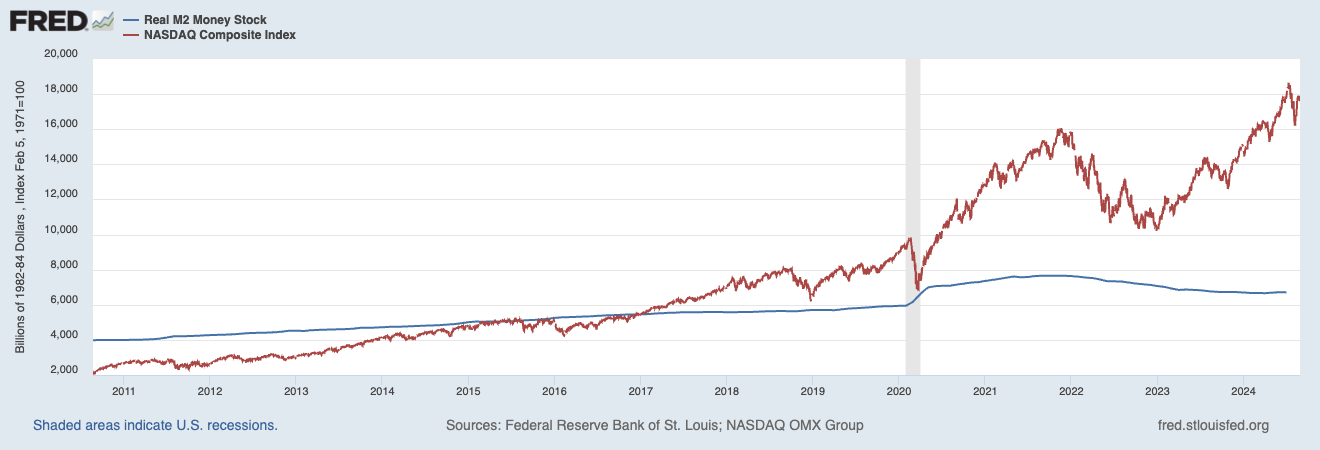
This graph compares the Real M2 Money Stock (blue line) and the NASDAQ Composite Index (red line) from 2010 to 2024. The M2 money supply remained relatively stable with a gradual upward trend until 2020, when it spiked sharply in response to the COVID-19 pandemic, reflecting the massive monetary stimulus injected into the economy. The NASDAQ, which tracks technology-heavy stocks, also followed an upward trend but showed much more volatility, with sharp dips, particularly around early 2020, when markets reacted to the pandemic. However, similar to the S&P 500, the NASDAQ rebounded rapidly after the liquidity boost in 2020 and experienced significant growth through 2021. Post-pandemic, while the money supply leveled off and slightly declined after 2021, the NASDAQ continued its upward climb until mid-2023, highlighting how monetary stimulus and easy credit can fuel asset price inflation. Even as the money supply started contracting due to monetary tightening, asset prices, particularly in the technology sector, remained elevated, driven by market momentum and investor expectations. This divergence points to the delayed or decoupled effect of money supply changes on asset prices.
To put it simply: the increase in the money supply has significantly driven inflation post pandemic. But it was not the only cause of inflation. Let’s get into the demand pull inflation we saw.
Demand-Pull Inflation
"[Demand Pull] Inflation occurs when the demand for goods and services exceeds their supply, often due to an increase in the money supply or government spending." - Frederic S. Mishkin
Demand-pull inflation occurs when demand for goods and services exceeds supply in the economy. We can loosely define demand here as competition for goods.
The link between demand-pull inflation and monetary inflation is clear: an increase in the money supply often fuels demand-pull inflation. When consumers have more money in their pockets—due to, say, lower interest rates or direct government stimulus—they tend to spend more. This surge in demand, if not accompanied by a corresponding increase in production, results in demand-pull inflation. Essentially, monetary inflation can be the catalyst that sparks demand-pull inflation by empowering consumers with more purchasing power, which then strains supply. So this partially relates to our previous section on Monetary Inflation.
But there are other perspectives/aspects/realities that result in demand pull inflation:
When consumers feel confident, they spend more and take on more debt. This leads to a steady increase in demand, which means higher prices.
Expectations of inflation in the future can lead to increased spending now, which can further drive up prices.
Panic buying, such as the rush to purchase toilet paper during a crisis, can cause temporary demand-pull inflation by sharply increasing demand for certain goods, outstripping supply, and driving prices up in the short term.
Uncertainty about future supply can lead to temporary demand-pull inflation as consumers and businesses, fearing shortages, increase their current purchasing to secure goods, thereby pushing prices higher due to the sudden surge in demand.
A strong economy, characterized by low unemployment and increased government spending, can lead to demand-pull inflation.
Changing consumer preferences.
This imbalance between supply and demand leads to an increase in prices because consumers are willing to (or have to) pay more to obtain the goods and services they desire.
So, let’s look into the aspects of the demand-pull inflation we are currently seeing in our economy.
Government Spending (Fiscal Policy):
Government spending plays a pivotal role in shaping economic demand. When the government injects significant funds into the economy, it increases aggregate demand. This surge in demand, if unmatched by a corresponding increase in supply, drives prices up, leading to demand-pull inflation.
Government spending is inflationary, period. It increases the set of money competing for raw materials, labor, capital (defined here as including capital equipment), financing, etc., which results in inflation.
Covid Relief Spending:
During the COVID-19 pandemic, governments worldwide implemented large-scale relief programs to support individuals and businesses affected by lockdowns and economic disruptions. In the U.S., this included direct stimulus payments, enhanced unemployment benefits, and small business loans. While these measures were essential to avoid economic collapse, they significantly increased consumer spending power, particularly for consumer staples and discretionary items. The sudden surge in demand, coupled with supply chain disruptions, contributed to notable price increases. While some of these funds were used to pay off debt—potentially deflationary—the overall effect was a substantial boost in demand, contributing to inflationary pressures.
Infrastructure Spending:
Infrastructure Investment and Jobs Act:
The Infrastructure Investment and Jobs Act aims to modernize America’s infrastructure by funding roads, bridges, public transit, and broadband internet expansion. While these projects are crucial for long-term economic growth and competitiveness, they also increase demand for raw materials, labor, and capital in the short term. The heightened demand for these resources, in an economy already grappling with supply constraints, exacerbates inflationary pressures. The increased spending in sectors like construction and manufacturing fuels demand-pull inflation as the economy's supply capacity struggles to keep pace with the sudden surge in demand.
Inflation Reduction Act:
The Inflation Reduction Act includes significant subsidies for green energy projects. These subsidies increase demand for materials and labor in the renewable energy sector. While these investments are vital for transitioning to a sustainable economy, they contribute to inflation in the short term by driving up demand for scarce resources, such as rare earth metals, skilled labor, and manufacturing capacity. This demand-pull inflation occurs because the economy’s supply-side cannot instantly scale to meet the rapid increase in demand spurred by these subsidies.
Reshoring critical industries (CHIPS and Science Act)
The CHIPS and Science Act is designed to bolster the U.S. semiconductor industry, reducing dependency on foreign suppliers, particularly from Taiwan. This act represents a strategic response to supply chain vulnerabilities exposed during the pandemic. However, reshoring efforts are inflationary because they involve massive investments in new production facilities, workforce training, and research and development. The demand for construction materials, skilled labor, and specialized equipment increases as companies build domestic semiconductor manufacturing capabilities. Additionally, the time it takes to develop the necessary skills and infrastructure means that, in the interim, supply shortages can persist, driving prices higher. The urgency of securing semiconductor supply chains, especially given geopolitical risks, has fueled demand-pull inflation in this critical sector.
All of the above are significantly inflationary.
While each of these factors contributes to demand-pull inflation, they were also necessary interventions. The COVID relief spending prevented a deep recession (possibly depression) and alleviated widespread economic hardship. Infrastructure investments are vital for long-term economic resilience and competitiveness. The Inflation Reduction Act addresses the urgent need for climate action, and the CHIPS Act is crucial for securing supply chains in a world where geopolitical tensions are rising. These measures are inflationary in the short term, but their long-term benefits are intended to enhance economic stability, security, and growth, ultimately helping to moderate inflation as the economy adapts and supply catches up with demand.
Labor Cost Inflation:
Labor is a key component in every industry, so when it goes up, all other prices go up.
Demand-pull inflation in the labor market from 2020 to 2024 can be attributed to several factors that significantly increased the demand for labor while supply struggled to keep pace. This period saw a combination of economic recovery efforts, government interventions, and structural shifts that contributed to rising wages and labor costs, which are key indicators of demand-pull inflation in the labor market.
Key Factors Driving Labor Market Demand-Pull Inflation:
Economic Recovery Post-COVID-19: After the initial shock of the COVID-19 pandemic in 2020, economies began to recover, particularly in 2021 and beyond. Governments implemented significant fiscal and monetary stimulus measures to support this recovery, leading to a surge in demand for goods and services. As businesses rushed to meet this increased demand, they needed more workers, leading to a spike in labor demand. However, the labor supply did not rebound as quickly due to ongoing health concerns, early retirements, and changes in workforce participation, causing wages to rise as businesses competed for a limited pool of workers.
Government Stimulus and Relief Programs: The various stimulus programs, including direct payments to households, extended unemployment benefits, and small business loans, provided consumers with increased spending power. This led to a rapid rebound in consumer demand, particularly in sectors like retail, hospitality, and manufacturing. As businesses sought to ramp up operations to meet this demand, they faced a tight labor market, pushing wages higher. The enhanced unemployment benefits also created a situation where some workers were less incentivized to return to lower-paying jobs, further constraining labor supply and driving up wages.
Structural Shifts and Labor Shortages: The pandemic accelerated certain structural shifts in the labor market, such as the move toward remote work and the increased reliance on e-commerce. These shifts created mismatches between the skills available in the labor market and the skills demanded by employers. Sectors like technology, logistics, and healthcare saw a particularly high demand for skilled workers, leading to wage inflation in these areas as companies competed for a limited talent pool. Additionally, industries that rely on physical presence, such as hospitality and retail, faced significant challenges in attracting workers back, leading to higher wages to lure them in.
Supply Chain Disruptions and Reopening Effects: As global supply chains were disrupted during the pandemic, companies faced increased costs and delays in obtaining materials and goods. To compensate, many businesses offered higher wages to attract and retain workers who could help them navigate these challenges. Additionally, as economies reopened, there was a sudden surge in demand for services that had been restricted during the pandemic, such as travel, dining, and entertainment. This surge exacerbated labor shortages, as many workers who left these industries during the pandemic did not return, leading businesses to raise wages to attract new employees.
Inflation Expectations and Wage Demands: As inflation began to rise in the broader economy, workers began to anticipate higher costs of living. This expectation led to increased wage demands as workers sought to maintain their purchasing power. In response, employers, especially in competitive industries, raised wages to retain talent and avoid turnover, contributing to further demand-pull inflation in the labor market.
From 2020 to 2024, the labor market experienced significant demand-pull inflation due to a confluence of factors, including robust economic recovery efforts, government stimulus programs, structural shifts in the economy, supply chain disruptions, and rising inflation expectations. These factors collectively drove up the demand for labor while supply remained constrained, leading to higher wages and increased labor costs across various sectors. This wage inflation was a key component of the broader inflationary pressures seen in the economy during this period.
Immigration:
Immigration during the 2020-2024 period played a nuanced role in demand-pull inflation. As economies recovered from the COVID-19 pandemic, there was a renewed focus on filling labor shortages across various industries, particularly in sectors like agriculture, construction, healthcare, and hospitality, which have traditionally relied on immigrant labor. Increased immigration helped meet some of the heightened demand for workers, particularly in lower-wage, labor-intensive jobs.
However, the influx of immigrants also contributed to demand-pull inflation in a few ways:
1. Increased Consumer Demand: Immigrants entering the country contribute to overall consumer demand as they need housing, food, transportation, and other goods and services. This increased demand, especially in a recovering economy with existing supply constraints, can lead to higher prices, contributing to demand-pull inflation.
2. Housing Market Pressure: Many immigrants settle in urban areas where housing supply is often already tight. The increased demand for housing can drive up real estate prices and rents, leading to inflation in the housing sector. Higher housing costs can ripple through the economy, contributing to overall inflation.
3. Public Services and Infrastructure: The demand for public services and infrastructure, such as education, healthcare, and transportation, can increase with higher immigration levels. If government spending on these services rises to meet the needs of a growing population, it can contribute to demand-pull inflation as more money competes for the same resources.
While immigration helped alleviate some labor shortages, it also added to demand pressures in the economy by increasing the need for goods, services, and housing, contributing to demand-pull inflation during the 2020-2024 period.
Immigration also has deflationary aspects which we will get to later.
Summary:
The above are some of the aspects of demand-pull inflation that effected and are still in small ways effecting our inflation. Let’s move on to Cost-Push.
Cost-Push Inflation
Cost-push inflation occurs when the overall cost of production rises, leading to an increase in the prices of goods and services. Unlike demand-pull inflation, where higher demand drives up prices, cost-push inflation is driven by rising input costs. These costs can include raw materials, energy, labor, or other factors of production. When these costs rise, producers often pass them on to consumers in the form of higher prices, even if demand remains unchanged. In recent years, several key factors have contributed to the cost-push inflation we are currently experiencing.
Economic Shutdowns
One of the most significant contributors to cost-push inflation during the pandemic was the widespread economic shutdowns that disrupted production on a global scale. Factories, businesses, and supply chains came to a halt as governments imposed lockdowns to curb the spread of COVID-19. The sudden drop in production capacity created supply shortages across multiple industries. With fewer goods being produced, the reduced supply pushed prices higher, contributing to inflationary pressures.
The production halt also resulted in lingering bottlenecks, as it took time for businesses to ramp up production again, even as demand surged. This mismatch between limited supply and recovering demand led to significant price hikes, particularly in essential goods and materials.
Supply Chain Disruptions
The pandemic also exposed the vulnerabilities of global supply chains. As shipping lanes were shut down and borders closed, goods became harder to move across the globe. This was particularly evident in key sectors such as manufacturing, agriculture, and construction, where supply chain disruptions led to a shortage of crucial inputs. For instance, the lumber industry in Canada was hit hard by transportation issues, leading to higher prices for construction materials, which, in turn, contributed to US housing inflation. Similarly, disruptions in the food supply chain caused significant increases in food prices, with consumers feeling the effects at grocery stores.
Shipping delays and increased transportation costs further exacerbated the problem. The increased cost of shipping raw materials and finished products across borders added to the overall cost of goods, contributing to cost-push inflation across multiple sectors.
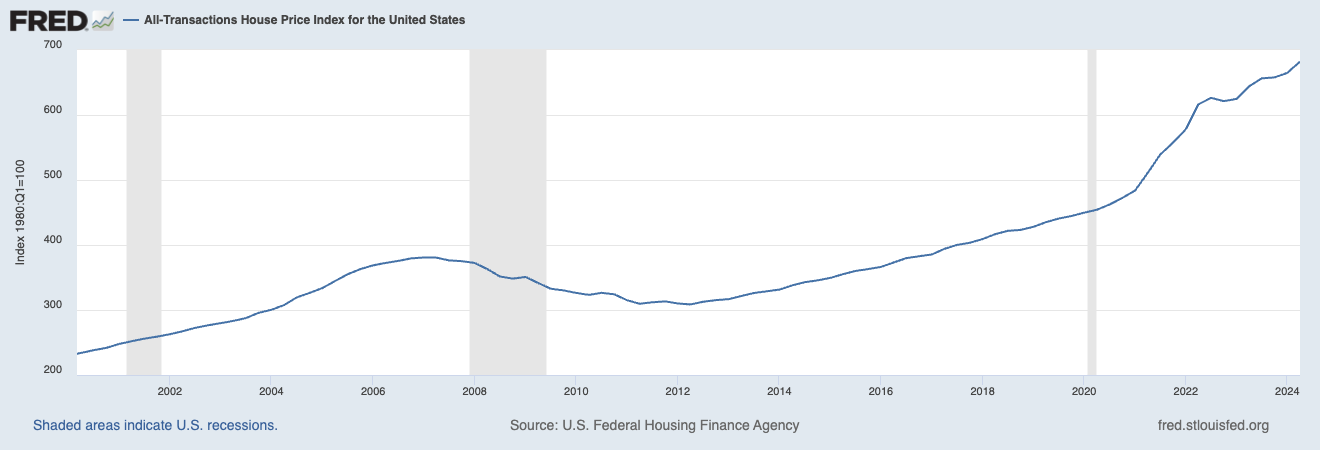
Housing Inflation
Housing is another sector significantly impacted by cost-push inflation. The combination of supply chain disruptions, rising raw material costs (such as lumber), and increased demand for housing has driven up home prices and rental costs. As construction materials became more expensive and scarce, builders passed these increased costs on to homebuyers, contributing to an inflationary spiral in the housing market. This not only affected new home construction but also renovations and repairs, as homeowners faced higher prices for materials and labor.
Geopolitical Tensions
Geopolitical events have also played a critical role in fueling cost-push inflation. One of the most significant recent examples is the conflict in Ukraine. The war has disrupted global supplies of key commodities, particularly energy, fertilizer, and grain.
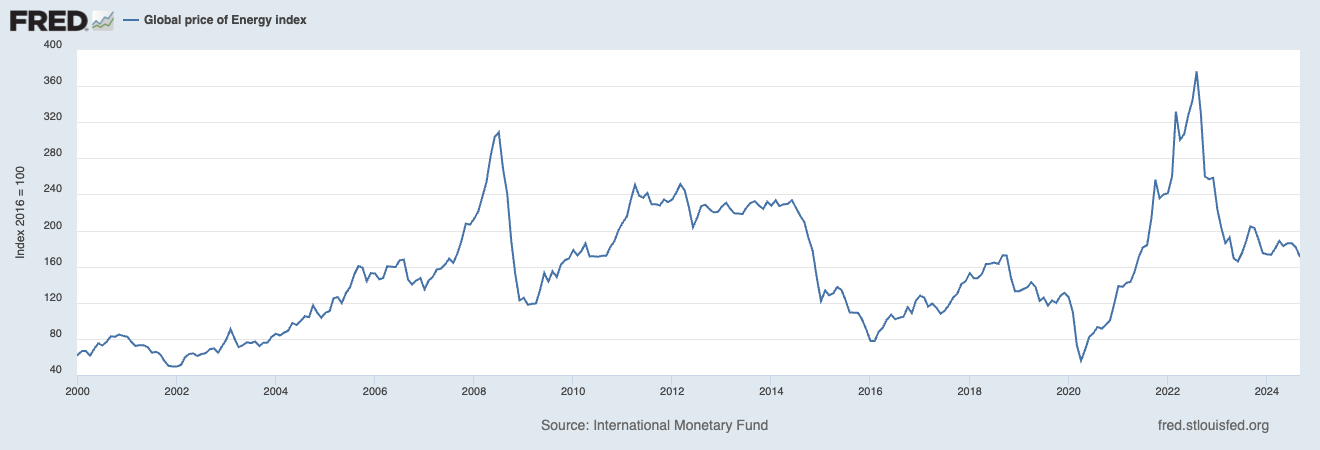
Energy
Energy prices, particularly oil and natural gas, spiked as a result of the war (though they have somewhat normalized), as well as broader geopolitical tensions between major energy-producing nations. Energy is a critical input in almost every industry, and when energy costs rise, they increase the cost of production for nearly all goods and services. Higher energy prices reverberate through the economy, raising the cost of transportation, manufacturing, and food production.
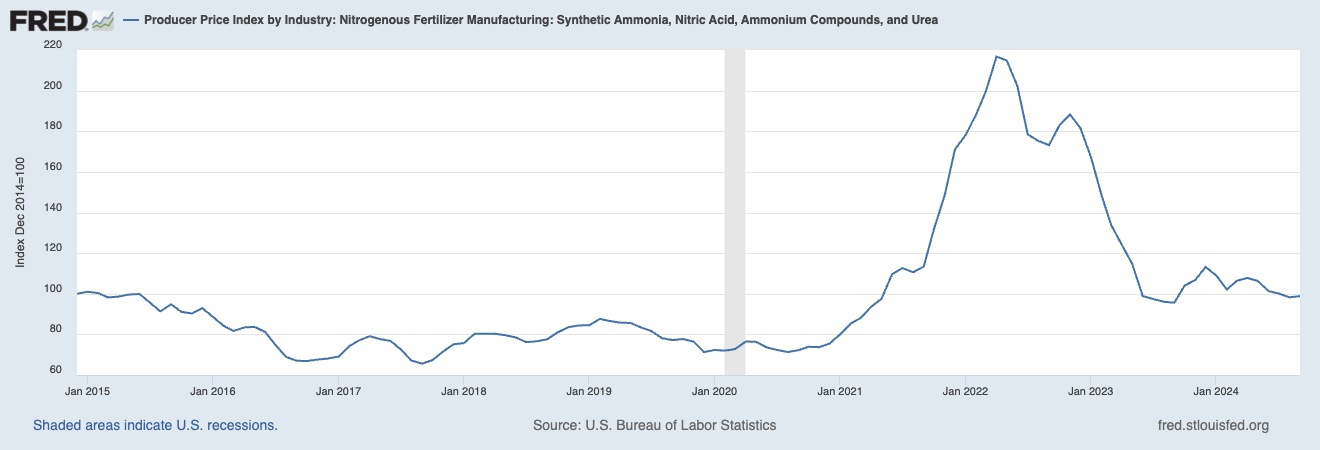
Fertilizer
Prior to the war in Ukraine, Russia was a major player in the global fertilizer market, producing about 25% of the world's nitrogen fertilizer and a significant share of other fertilizers, including roughly 40% of global potash exports and a large portion of phosphate fertilizers (Link, Link). The conflict, along with sanctions on Russia, severely disrupted these supply chains, leading to a sharp increase in fertilizer prices. Additionally, the production of nitrogen-based fertilizers relies heavily on natural gas through the Haber-Bosch process, which synthesizes ammonia from nitrogen and hydrogen. As energy prices, particularly natural gas, surged due to geopolitical tensions, the cost of producing fertilizers skyrocketed. This inflation in energy costs directly impacted fertilizer prices, forcing farmers to face much higher input costs. These increased costs have ultimately been passed on to consumers, driving up food prices globally.
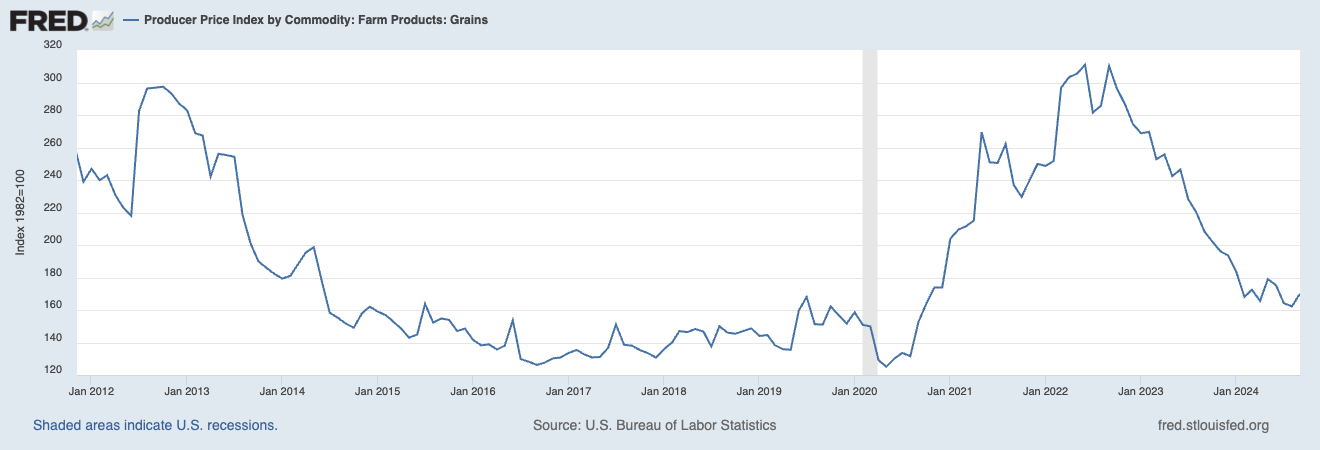
Grain
Ukraine, one of the world's largest grain producers, has struggled to export its agricultural products due to the ongoing conflict, leading to a rise in global food prices. This rise in grain prices has a ripple effect throughout the global food industry, as grains are not only used directly for food but also to feed livestock, further driving up meat and dairy prices.
Houthi Conflict in Sea of Aden
The ongoing Houthi conflict in the Sea of Aden is significantly increasing shipping costs due to heightened security risks and disruptions in one of the world’s most strategic maritime routes. The Sea of Aden, which connects the Red Sea to the Indian Ocean via the Suez Canal, is a critical passage for global trade, particularly oil shipments from the Middle East to Europe and Asia. The conflict has led to frequent attacks on vessels, including missile strikes, drone attacks, and the seizure of commercial ships, prompting shipping companies to reroute vessels, invest in enhanced security measures, and pay higher insurance premiums. These additional costs, driven by the instability in the region, have contributed to rising global shipping expenses, further exacerbating inflationary pressures on goods transported through this vital waterway.

Trade Wars and Protectionism
Trade tensions and protectionist policies also contribute to cost-push inflation by raising the cost of imported goods and materials. The imposition of tariffs and trade restrictions between major economies—such as the U.S. and China—has increased the cost of key imports. These increased costs, whether they are raw materials, intermediate goods, or finished products, are often passed on to consumers. Trade barriers can disrupt the efficient flow of goods and services, leading to supply shortages and higher production costs, which contribute to short-term, possibly long-term, inflationary pressures.
Energy Inflation
Energy is a critical input for nearly every industry, from manufacturing to agriculture, to transportation, and its cost has a disproportionate impact on inflation. As energy prices rise, they increase the cost of producing goods and services across the board. This is particularly true for industries that are heavily reliant on energy, such as manufacturing, agriculture, and logistics. For instance, higher oil prices increase transportation costs, while rising natural gas prices drive up electricity costs for businesses and consumers alike.
Summary
Cost-push inflation has played a significant role in driving up prices across the economy in recent years. From the disruptions caused by the pandemic to geopolitical conflicts and trade tensions, rising input costs have forced businesses to raise prices, contributing to the inflationary pressures we see today. While these factors have caused significant short-term pain, they also highlight the interconnected nature of global supply chains and the importance of addressing these vulnerabilities to prevent future inflationary shocks.
Pricing Power Inflation
Pricing Power Inflation arises when businesses use their market position or broader economic conditions to raise prices more than their own rising costs alone would justify. Although genuine cost pressures—such as energy or raw materials—frequently spark initial price hikes, some firms may continue raising prices even after covering higher expenses. The question: Is this savvy business (pricing power) or exploitative profiteering (price gouging)?
The “Price Gouging” Debate
Given the pain of grocery inflation since COVID-19, it’s understandable for consumers (and politicians) to suspect “price gouging.” Yet, recent evidence doesn’t always back that up. An August 2024 Yahoo Finance analysis titled “Evidence of Food Price Gouging is Hard to Find” examined profit and cost data from eight different segments of the food industry—ranging from agriculture and processing to retail—and compared pre-COVID (2016–2019) to post-COVID (2022–2024) results:
Profit vs. Cost Trends
In only three of the eight segments did profits rise faster than costs, suggesting those firms were passing on their own cost increases and then some.
For the other five segments, costs actually outpaced profit growth. That implies many food firms have been absorbing higher costs rather than consistently offloading them to consumers.
Agriculture Products
The steepest profit jump was in agriculture (e.g., grain storage, processing, farm services), where profits rose by 129% while costs rose by 75%. A large player in this space is ADM (formerly Archer Daniels Midland). Its profit margin rose from around 2.4% before COVID to 4.3% at the inflation peak in 2022—an increase, but hardly matching the eye-popping margins one might expect from “rampant gouging.”
ADM’s margin has since drifted down, hinting that today’s more competitive landscape is curbing any short-term profit surge.
Retailers (Walmart, Costco, etc.)
Consumer staples retailers grew profits by 67% and costs by 51%. This mild gap could be due to operational efficiencies or improvements in inventory management—not necessarily predatory pricing.
Bottom Line: If widespread price gouging were the main driver of inflation, you’d expect to see substantially larger jumps in profits across most of the food industry. Yet the data suggests only pockets of higher profit margins—not a systemic wave of profiteering. That doesn’t mean individual examples of “gouging” never occur, but it does cast doubt on the idea that greed alone explains broad-based inflation at the grocery store.
Where Pricing Power Fits In
Even though the Yahoo Finance analysis tempers claims of runaway profit-taking, pricing power still matters. Several factors can let businesses charge more without a proportional cost bump:
Consolidation & Limited Competition
In industries with few dominant players—e.g., certain agricultural processing, meatpacking, or consumer-staple manufacturing—customers have fewer alternatives. This can increase a firm’s ability to raise prices and maintain margins.
Inelastic Consumer Demand
Products like basic groceries, medications, or utilities are “needs,” not “wants.” Consumers have little choice but to buy—even if prices creep higher—which grants firms an edge in pricing.
Psychological “All-Prices-Up” Environment
When consumers expect most goods to get more expensive, modest price hikes can be easier to slip by. People may grumble, but they’re conditioned to see inflation everywhere.
Pandemic & Geopolitical Cover
Legitimate cost surges in labor, energy, and transportation (driven by events like COVID-19 and Russia’s invasion of Ukraine) also gave some firms “air cover” to push prices further—without much public outcry—because inflation felt inevitable.
The Other Big Drivers: Labor & Input Costs
Other forces are often the true culprits behind stubborn food inflation:
Labor Costs
From 2022 onward, wages have grown at about 4.6% per year—much higher than the ~2.2% yearly rise from 2010–2019. Higher pay helps workers but also increases costs for every link in the supply chain.Energy & Transportation
Russia’s war in Ukraine pushed up oil prices in 2022, while fertilizer costs soared, and shipping disruptions lingered. Once those higher costs ripple through the supply chain, final prices on store shelves nearly always go up.Supply Chain Constraints
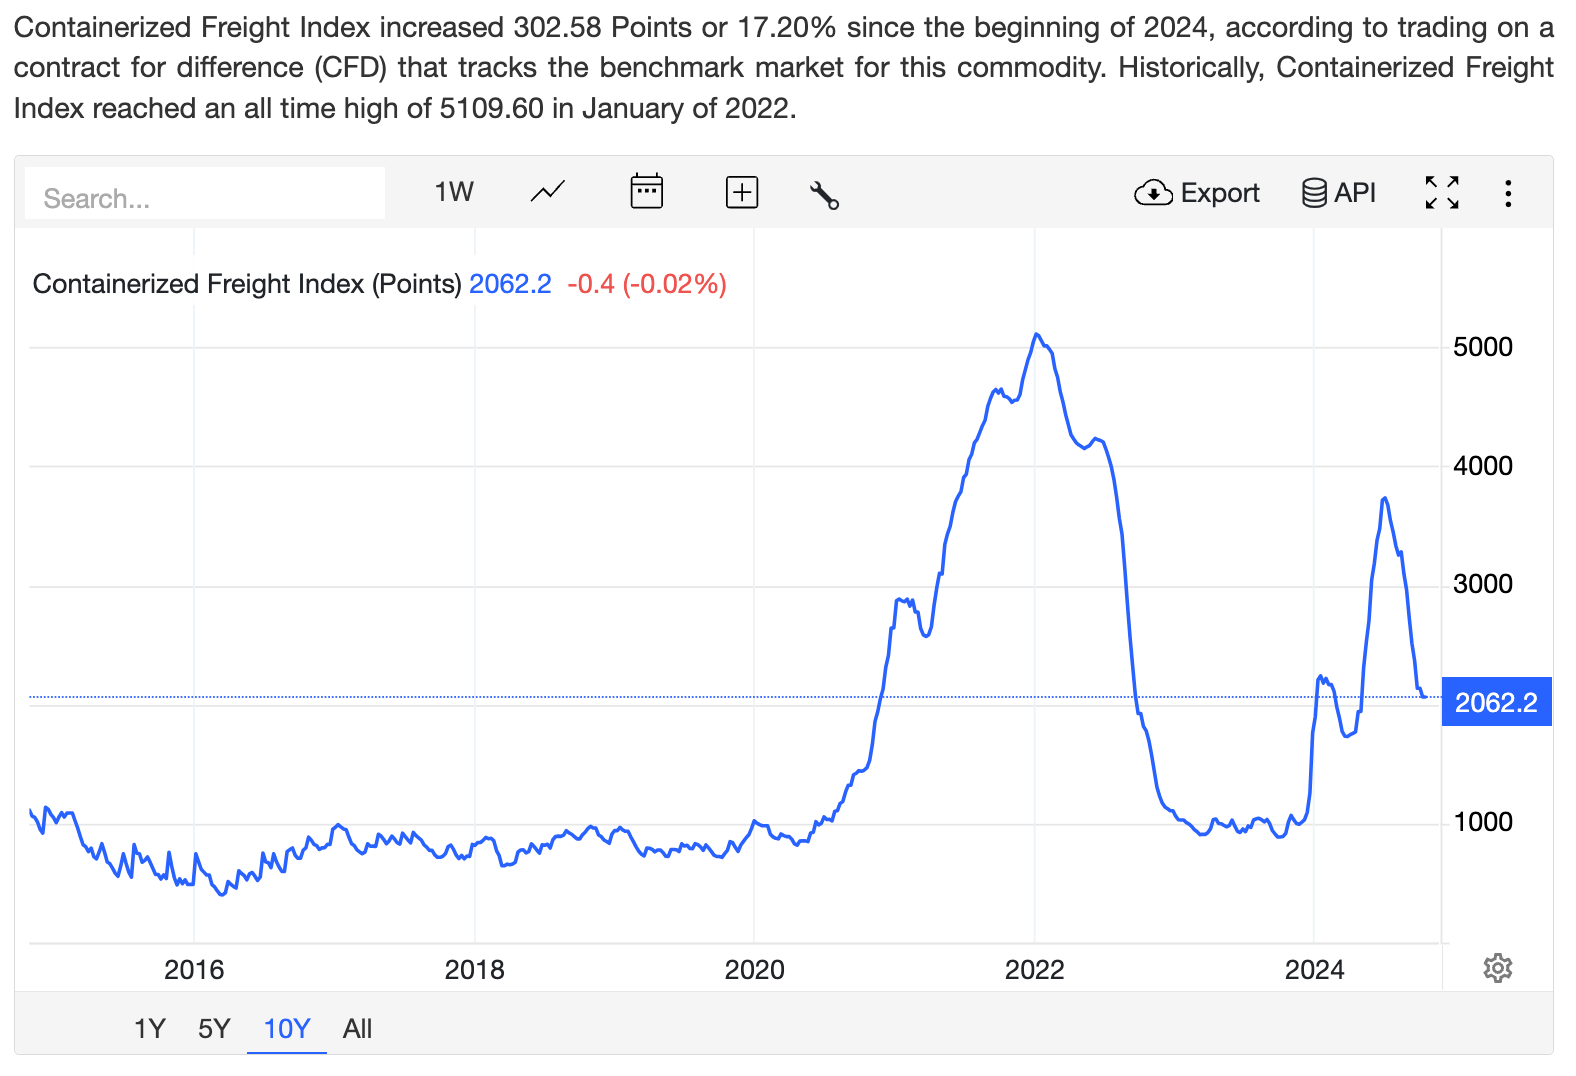
COVID-era bottlenecks have improved, but not vanished. Freight costs remain elevated in some channels, and production lead times are still longer than pre-pandemic norms.
Pricing Power Inflation Conclusion
Pricing Power Inflation is real, but it’s only one thread in the inflationary tapestry. High-level data from the food industry suggests many firms have faced genuine cost pressures—rather than uniformly exploiting consumers. Some pockets of the market (like agricultural processors or certain retailers) did expand margins, but they’re not posting profits so outsized as to single-handedly drive the 20%+ jump in grocery prices since 2021.
A balanced view:
Yes, some companies have used the inflationary backdrop to raise prices more aggressively, boosting profits in ways that feel like “price gouging” to some shoppers.
No, it doesn’t appear to be a blanket phenomenon. Rising labor costs, supply disruptions, and global turmoil remain the core forces propelling grocery bills upward.
In short, the search for an all-purpose villain may be unsatisfying because the real driver of post-2020 inflation is far more nuanced and interconnected than mere corporate greed. As we’ve seen throughout this broader discussion—from monetary and demand-pull factors to cost-push and geopolitical shocks—today’s inflation is a tapestry of interlocking causes. Pricing Power Inflation is part of that story, but by no means the entire plot.
Inflationary Pressures Conclusion:
Inflation is rarely the result of a single factor, and our journey through Monetary Inflation, Demand-Pull Inflation, Cost-Push Inflation, and Pricing Power Inflation illustrates just how multifaceted the causes can be. Each pressure pushes or pulls the economic hydraulic system in its own distinct way—whether it’s an overabundance of money supply fueling demand, a flurry of consumer spending outstripping the available goods and services, skyrocketing production costs, or companies wielding newfound pricing power amid global upheaval.
What emerges from these overlapping forces is a tapestry of inflationary pressures that cannot be reduced to a single culprit. Instead, we find a network of dependencies and triggers:
Monetary Inflation can act like rocket fuel for demand, igniting a surge in spending power that outpaces real production gains.
Demand-Pull Inflation thrives when consumers and businesses chase a finite pool of goods and services, nudged along by confidence, low interest rates, or government stimulus.
Cost-Push Inflation shows up when supply disruptions, rising labor expenses, geopolitical conflicts, or energy shortages force producers to pass on higher costs to consumers.
Pricing Power Inflation creeps in when certain sectors or companies leverage brand loyalty and consolidated markets to expand margins beyond what their own costs demand.
The sheer number of interdependencies—where an action in one corner of the economy sets off a ripple of compensations, distortions, and counteractions—underscores the complexity we face. What we label “inflation” is in fact a chorus of factors singing in discord, each voice impacting the others. That discord sometimes crescendos into headline inflation rates that seem impossible to tame, but it also offers opportunities to spot imbalances early and moderate them before they turn into crisis points.
Looking ahead, it’s clear that our inflation story doesn’t stop here. In the next sections, we’ll explore Deflationary Pressures that act like counterweights—reminding us that inflation can’t perpetually accelerate without colliding with opposing forces. By examining these push-and-pull dynamics together, we can better appreciate how a system under stress searches for equilibrium, even if that balance point shifts in a world as dynamic as ours.
In the end, acknowledging the tangled network of causes is the first step toward understanding and, hopefully, managing the inflation we live with today. By seeing each factor in context, we’re far better equipped to navigate, adapt, and make sense of our rapidly changing economic landscape.
Deflationary Pressures
Although the past few years have been punctuated by surging prices and persistent inflation, it’s vital to acknowledge that certain dynamics have exerted deflationary or at least disinflationary pressures during the same window. These forces operate like counterweights against the various inflationary drivers—not eliminating them outright, but helping to temper or delay the full impact.
1. Monetary Policy and Its Mixed Effects
The Federal Reserve’s interest rate hikes represent a classic deflationary tool, aimed at cooling demand and restraining price growth. As the Fed raised rates between 2021 and 2024 (in response to mounting inflationary pressures), the immediate effect was to dampen spending and borrowing:
Reduced Demand: Higher rates made everything from mortgages to business loans more expensive, lowering disposable income for consumers and shrinking capital for businesses.
Slower GDP Growth: With costlier loans, businesses often put expansion or investment plans on hold, restraining overall economic activity and, by extension, demand-pull inflation.
Yet, monetary policy’s deflationary impact cuts both ways. While it can tame excessive demand, it also constrains investment in productivity-enhancing projects—new factories, updated tech, supply chain innovations. This stifles the very supply-side improvements that might alleviate cost-push inflation in the long run. For instance, a construction firm facing higher loan costs might shelve a plan to build desperately needed housing units, keeping housing supply tight and prices elevated. So, even as interest rate hikes help rein in demand-pull inflation, they can inadvertently reinforce other inflationary pressures by limiting future productive capacity.
2. Immigration as a Labor-Force Pressure Valve
Immigration during the post-COVID recovery proved to be a double-edged sword for inflation:
Deflationary on Wages: By helping fill critical labor shortages in sectors such as agriculture, construction, healthcare, and hospitality, new arrivals took some of the heat off wage growth. If employers can hire from a larger labor pool, they face less pressure to aggressively raise wages—thus easing at least one component of inflation (labor costs).
Increased Consumer Demand: At the same time, each new resident also needs housing, food, and transportation, adding to overall demand. This is mildly inflationary.
Net effect? The labor-market stabilization often yields a deflationary tilt—particularly if the supply of workers grows faster than new demand for resources. In a number of industries, that extra labor capacity helped businesses meet surging orders more efficiently, preventing certain choke points that might otherwise have driven costs even higher.
3. Easing Supply Chain Disruptions
Early in the pandemic, severe supply chain blockages led to scarcity-driven price spikes, a classic cost-push scenario. However, as transportation routes stabilized and port backlogs cleared, these systems adapted:
Shipping Costs: The cost of shipping containers peaked in 2021–2022, then began easing as new carriers entered the market and ports implemented more efficient workflows.
Global Production Shifts: Companies rearranged supply chains, diversifying production hubs or stockpiling crucial materials to avoid future bottlenecks. These adjustments helped reduce the supply shocks that spur cost-push inflation.
While not traditionally labeled “deflationary,” these improvements curbed some of the extreme cost surges we saw in 2020–2021, effectively acting as a pressure relief valve on overall prices.
4. Productivity Gains and Technological Advances
It’s easy to overlook, but productivity enhancements—whether through automation, software efficiencies, or simpler process innovations—tend to have a deflationary effect:
Higher Output Per Worker: If a business can produce more goods or services per hour of labor, it counters both labor cost inflation and raw material bottlenecks.
Investment Trade-Off: The rub is that such productivity gains often require up-front investment in new technologies, which can be discouraged by higher interest rates. In other words, the Fed’s demand-curbing strategy can inadvertently starve the very investments that promote productivity-driven deflation.
5. Housing Market: Where the Tug-of-War Intensifies
The housing sector is a vivid example of how deflationary and inflationary forces can coexist:
Higher Mortgage Rates: As the Fed raised rates, borrowing costs climbed. This cools the housing market by reducing buyer demand—one could call that deflationary for home prices.
Constrained Supply: Simultaneously, high interest rates hamstring new construction projects and deter potential sellers who lock in low-rate mortgages and decide not to move. The result? A persistent supply shortage that props up housing costs, limiting how much real deflation can actually occur.
The net effect is a housing market stuck in a tug-of-war between rate-driven dampening of demand and insufficient supply that keeps prices stubbornly high.
6. A Balancing Act of Policy and Reality
Monetary policy is well-suited for curbing demand-pull inflation—for instance, by making it more expensive to borrow money for a new car or home renovation. Yet it’s less effective, and sometimes counterproductive, in tackling cost-push factors like supply chain blockages or an underbuilt housing market. When policy clamps down on broad economic activity, it can postpone the very investments that might reduce future inflation.
Meanwhile, immigration helps fill labor gaps but also adds new demand to the system, while productivity enhancements can drastically lower per-unit costs—assuming businesses are willing and able to invest in them. All these cross-currents highlight the complexity of our post-2019 economy: deflationary and inflationary pressures are constantly colliding, shifting, and intertwining in ways that are not straightforward to predict.
Conclusion: Deflationary Currents Beneath the Surface
Despite an environment often characterized by fast-rising prices and tightened wallets, deflationary undercurrents have continuously flowed beneath the surface from 2019 to 2024. From the Federal Reserve’s rate hikes that curb excess demand to increased immigration stabilizing wage growth, these factors have helped offset (or at least soften) some of the fiercest inflationary spikes.
However, it’s also clear that simply depressing demand isn’t a silver bullet. If we fail to address supply-side bottlenecks—like housing shortages or outdated infrastructure—then the Fed’s deflationary tools can inadvertently reinforce cost-push inflation down the line. For lasting stability, policymakers, businesses, and workers must work in concert, balancing the immediate need to cool prices with the longer-term goal of strengthening our productive capacity. Only by acknowledging these subtleties can we chart a path toward a more balanced economic future—one neither overheated by inflation nor chilled by stagnation.
Interest Rates & Policy:
When discussing inflation, we often hear about “tools” to manage it, and in the United States, that conversation typically centers on the Federal Reserve. In the simplest sense, the Fed raises or lowers interest rates to either slow the economy down (taming inflation) or spur it on (addressing recessionary risks). But as we’ve seen throughout this analysis, inflation is anything but simple—and the Fed’s interest rate decisions don’t always line up neatly with what commentators, investors, or even “conventional wisdom” might suggest.
Why Target 2%?
There’s a standard notion that a 2% inflation target is ideal: high enough to allow for wage growth, investment, and a moderate cushion against deflation, but low enough that prices remain relatively stable. However, this number is not etched in stone. Some economists argue it should be raised—maybe to 3% or even 4%—to allow more flexibility, especially following supply shocks or major global disruptions like COVID-19. The debate remains ongoing, and we may see shifts in consensus if inflation persists.
CME FedWatch & The Hopeful Bias
The CME FedWatch Tool is often cited in financial news as a barometer for where the Fed Funds Rate is headed. It aggregates market-based probabilities of future Fed rate moves—essentially, what traders and investors bet will happen. The trouble is, markets are inherently biased by participants who tend to want certain outcomes—particularly lower interest rates, because that often boosts stock valuations and lowers financing costs. It’s worth asking: are the predictions bullish because they’re grounded in sound economic analysis, or because the people making the bets stand to gain if the Fed pivots to rate cuts?
Early in 2024, for example, many analysts clung to the hope of an imminent rate cut, despite Fed Chair Jerome Powell’s repeated statements that it was premature. This dynamic, where the market’s “wishful thinking” runs counter to Fed guidance, seems like a recurring theme. In my own estimation, we’re more likely to see a first rate cut in September 2024 (yes I know this is outdated, but this was my prediction in March of 2024 and it was correct)—but that’s not because I’m ignoring Powell’s demeanor. Quite the opposite: if you’ve watched him at all, you’d see he’s been steady, cautious, and consistently determined to bring inflation closer to the Fed’s target before easing policy.
The Fed’s Tools: Great for Demand, Less for Supply
The Federal Reserve’s primary mechanisms—interest rates, reserve requirements, and open market operations—chiefly influence demand. By making borrowing more expensive (or cheaper), the Fed can nudge consumers and businesses to spend less (or more). Yet as we’ve explored, many of today’s inflationary factors (e.g., supply chain issues, geopolitical disruptions) don’t neatly respond to rate shifts. In fact, raising rates might hamper the supply side by discouraging the very investments that could expand production capacity and tackle cost-push inflation. A construction company, for example, might delay building much-needed housing if borrowing costs are too high—thereby reinforcing housing supply shortages and keeping prices elevated.
Looking Back, Looking Ahead
To analyze interest rates effectively, one must also reflect on the lagging nature of inflation data:
Delayed Indicators: Much of the information the Fed relies on (CPI, PCE, labor market reports) arrives weeks or months after real-world changes happen. The Fed is often reacting to data from a period already in the rearview mirror.
Multiple Indexes: Inflation isn’t monolithic; the Fed juggles CPI, PCE, core inflation, wage growth, and other signals to get a complete view. Observers who fixate on a single metric (like headline CPI) may overlook divergences in core components or other measures such as goods vs. services.
Given these delays and complexities, the Fed’s decision-making requires a substantial dose of patience. Powell has emphasized repeatedly that “staying the course” is crucial to avoid the mistakes of prematurely loosening policy—mistakes the Fed made in the 1970s, which led to repeated inflation flare-ups.
Beware of Bias
If you’re personally rooting for lower rates—perhaps because you’re in real estate, or you simply want cheaper credit so the growth stocks boom—acknowledge that bias. It can be all too easy to see every fleeting drop in a monthly CPI reading as proof a pivot is right around the corner, when the Fed’s tone or the labor market realities suggest otherwise.
In the same vein, if you hear commentators predicting rate cuts “any day now,” ask yourself: who benefits if the market believes that? Often, it’s those holding stocks, bonds, or properties that would get a value boost from cheaper borrowing. Equally, some economists might overshoot in the other direction, fixated on grim recession forecasts that align with their own academic frameworks or personal portfolios.
Psychological & Institutional Factors
As with the rest of our inflation discourse, human psychology and institutional culture loom large. Jerome Powell’s body language and calm, measured tone speak volumes: he’s not out to surprise markets with a rapid pivot. The Fed’s leadership is balancing the risk of overshooting (i.e., pushing the economy into a slowdown or even recession) against the risk of letting inflation run hot again. That tension guides their reluctance to announce victory prematurely. Given the lingering supply chain scars, labor issues, and the global context we’ve discussed, the Fed seems determined to make sure inflation is truly on a sustainable downward path before they shift gears.
Putting It All in Context
By now, it should be clear that monetary policy alone cannot solve an inflation problem fueled by a web of supply chain issues, labor market disruptions, fiscal stimulus, geopolitical tensions, and corporate pricing strategies. While higher rates can reduce demand and help quell certain types of inflation, they can also choke off investment that might have alleviated supply bottlenecks. It’s a balancing act, and each action ripples through the economy with a delayed and sometimes unpredictable effect.
So, does the Fed’s approach make sense? Possibly—if you believe demand has overshot enough to keep inflation embedded. Possibly not—if you think supply-side fixes and moderate inflation are already in the pipeline. Either way, it pays to watch more than just a single piece of data or a handful of market analysts. Look at the comprehensive picture: what are the indicators telling us about where inflation is truly heading, and how might the Fed’s next steps help—or hinder—the path to stable prices?
My bet? If we don’t see decisive evidence of inflation retreating, the Fed will stand firm until at least mid-year. I think the earliest realistic rate cut is September 2024—but that’s just my read of Powell’s messaging, the labor market’s resilience, and the lags in inflation data. Time (and a litany of economic reports) will confirm or deny that hunch soon enough.
Conclusion: What’s Next?
From pandemic-era stimulus and labor shortages to global supply chain snags and corporate pricing power, the inflation of 2019–2024 has been shaped by a rare convergence of pressures. We’ve seen monetary and fiscal policy collide with geopolitical events, all while consumers and businesses recalibrated how they spend and invest. At times, these forces reinforced each other, fueling rapid price increases across many sectors; at others, they canceled out, leaving certain areas of the economy surprisingly stable.
The result is an inflation story far more complicated than any single theory or historical parallel can capture. We’re witnessing an intricately woven tapestry, where the threads of monetary expansion, demand-pull surges, cost-push constraints, and good old-fashioned corporate pricing power meet the counterweights of deflationary pressures such as higher interest rates, immigration-driven labor supply, and gradual supply chain recoveries.
So, what’s next? The short answer is that the economic system remains fluid. There are clear signs of softening in some quarters—like a slowing housing market or easing shipping costs—while other indicators show resilience and persistent pricing pressure. Beneath these numbers lie the human factors of confidence, politics, and psychology, each influencing consumer behavior, corporate strategy, and the Federal Reserve’s posture.
If there’s one overarching lesson from the past several years, it’s that inflation is a constantly shifting target, shaped by real-time data and unexpected turns in global events. In response, policymakers, investors, and ordinary citizens must remain agile—monitoring multiple indicators, acknowledging their own biases, and remembering that what curbs inflation in the short run can sow the seeds for the next round of inflationary or recessionary cycles in the long run.
Whether we stabilize at 2%, 3%, or another target altogether, the path there will reflect the push-and-pull of market forces, consumer sentiment, and international developments. Ultimately, the best we can do is stay informed and keep a clear-eyed view of the many factors driving prices—knowing that while the precise future of inflation is uncertain, its complexity is an ever-reliable constant.